'A Conveyor Belt of Snow’; How Lake Effect Snow Can Bury Entire Towns in a Matter of Days

satellite image of lake effect snow over the Great Lakes, courtesy of the national weather service.

Following the incredible snowfall seen in Sault Ste. Marie and across parts of Muskoka over the weekend, we figured this would be the perfect opportunity to discuss lake effect snow. It’s something that many of us in Ontario have come to expect in the late fall and early winter, especially since we’re surrounded by the Great Lakes.


GOOGLE AD (NOT ENDORSED BY INSTANT WEATHER)

Certain ingredients are required for lake effect snow to occur, but most importantly, there needs to be an unfrozen body of water and a very cold air mass from the Arctic.

In order for lake effect snow to even start to form, there needs to be a temperature difference of at least 13°C between the warm surface of the lake and the 850mb pressure level of the atmosphere (this is typically found at around 1500 metres). The greater the temperature difference, the more unstable the atmosphere becomes and this is often when we see strong convection and the phenomenon known as thundersnow. Without this difference in temperature, lake effect snow simply can not occur. Once this threshold is reached, however, it’s like a switch being flipped and the lake effect snow machine starts.

Another key component in lake effect snow development is moisture. Ideally, the relative humidity at the surface needs to be at least 80% for lake effect snow to form and levels below 70% could actually inhibit development. It can usually be assumed that the lake itself can provide enough moisture, but this is not always true. There also needs to be limited wind shear with height between the surface and the 700mb pressure level so that the moisture is more focused, sort of like a hose. The strongest, most organized bands of lake effect snow develop when the wind shear is less than 30°.

Finally is the concept known as “fetch”. Yes, millennials, we’re trying to make fetch happen. Fetch is the distance that the air mass travels over the lake. Fetch needs to be at least 100km in order for lake effect snow to develop and the greater the fetch, the more snow is produced. When considering prevailing wind directions, the traditional snowbelts are found in areas that are downwind of the greatest possible fetch over the Great Lakes, i.e. Buffalo and the entire length of Lake Erie.


GOOGLE AD (NOT ENDORSED BY INSTANT WEATHER)

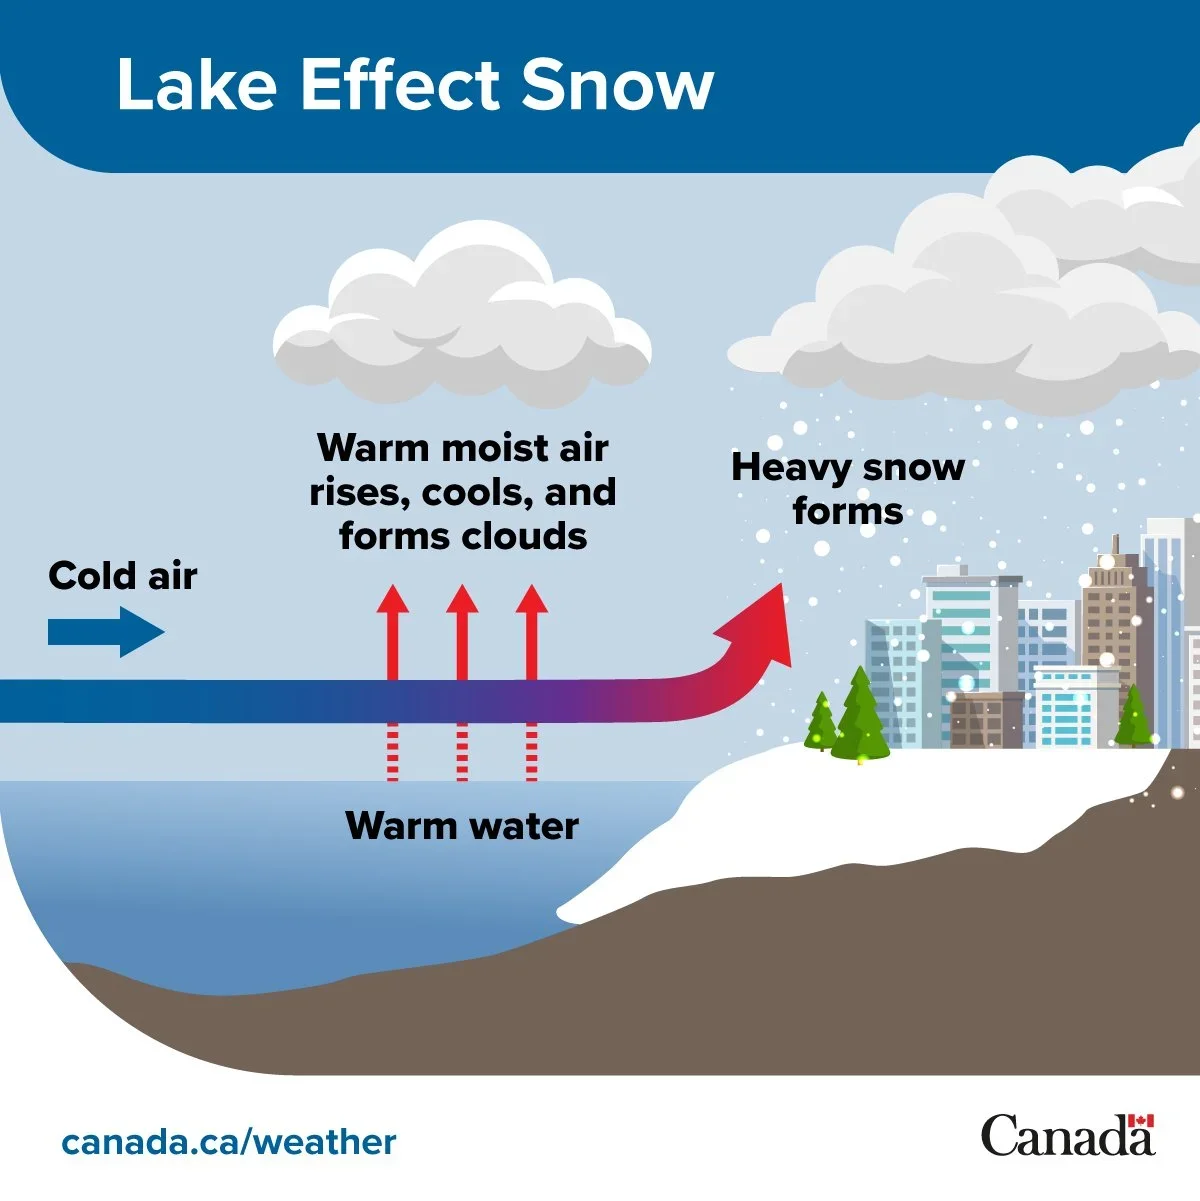
The creation of lake Effect Snow. Courtesy of Environment Canada.

When all of these conditions are met, we can see how lake effect snow actually develops.

As the cold air mass travels over the much warmer surface of the lake, the warmth and moisture from the surface is transferred into the lower atmosphere. The warmer, moister air rises and it eventually cools and condenses, forming narrow bands of clouds. These clouds continue to travel over the open lake, gathering even more moisture, until they eventually reach land and the snow starts to fall at rates that can easily exceed 5cm per hour and could even be as high as 20cm per hour! It’s important to note that the hardest hit areas are actually not found immediately at the shoreline, but rather 30-50km inland from the lake.

The direction of the winds dictates which areas are hit by the lake effect snow so as long as the ideal conditions continue, so too will the development and subsequent falling of lake effect snow. This could lead to several days of heavy snow hitting the same area while there are sunny skies less than 20km away. A slight shift in wind direction can quickly change which area gets hit and that makes lake effect snow notoriously tough to forecast.

"The Legend Lives On" With the 49th Anniversary of the Sinking of the Edmund Fitzgerald

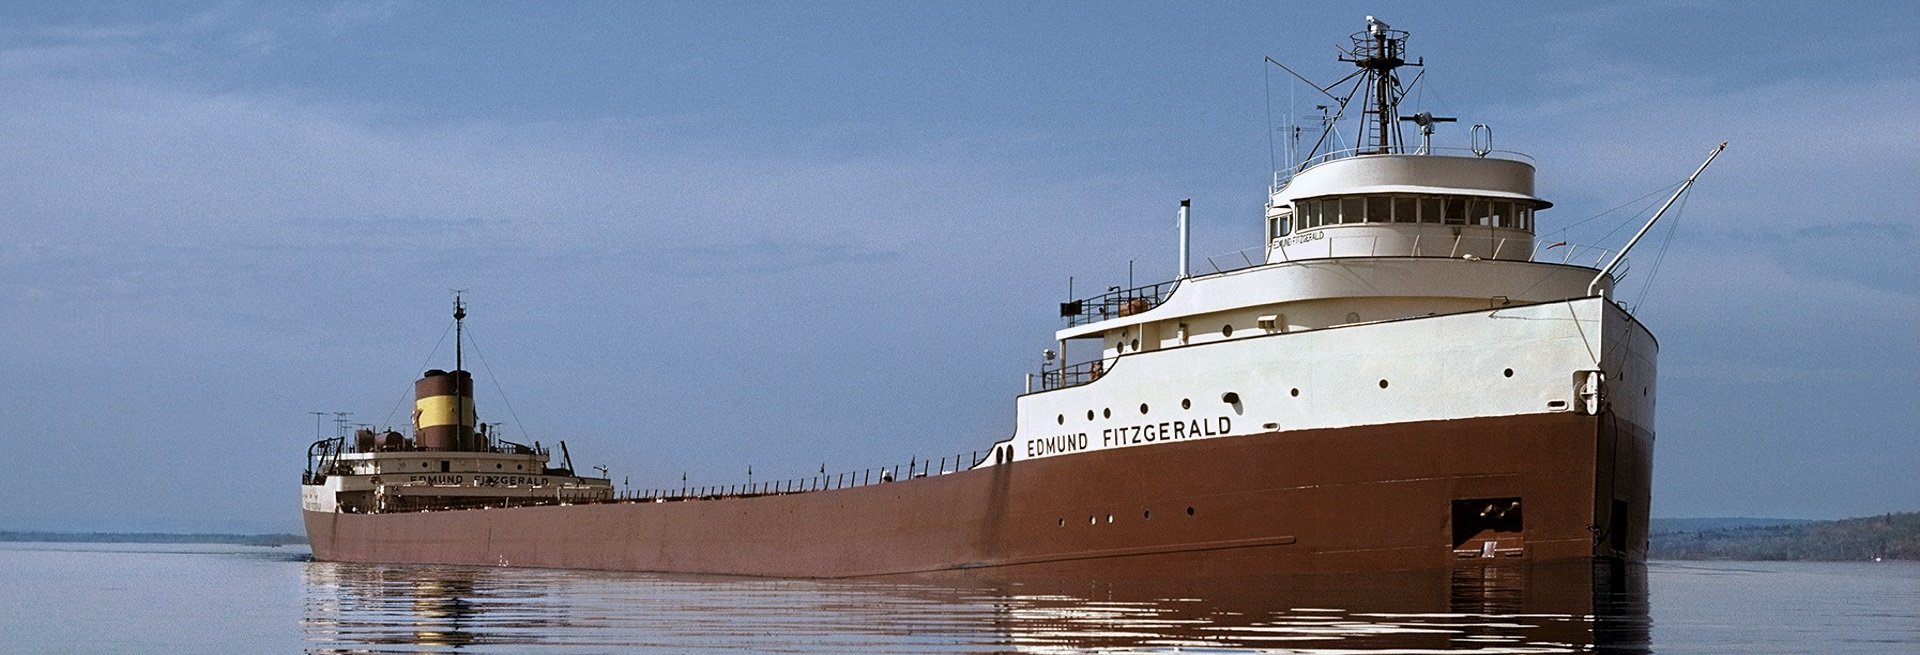
Photo of the Edmund Fitzgerald taken in 1975, courtesy of the Great Lakes Shipwreck Museum.

Today we remember the sinking of the Edmund Fitzgerald and the loss of her 29 crew members in 1975. Many Canadians and Americans are familiar with this now infamous event thanks to a very popular song by Gordon Lightfoot from 1976, The Wreck of the Edmund Fitzgerald. The ship sank 17 miles north-northwest of Whitefish Point, just outside of Whitefish Bay, an area that is sadly full of shipwrecks. To this day, there has been no official cause behind the wreck, but the weather was very likely a factor.


GOOGLE AD (NOT ENDORSED BY INSTANT WEATHER)

The tracks of the Edmund Fitzgerald and the nearby Arthur M. Anderson, Courtesy of the National Weather Service.

Lake Superior is known for its intense November storms, known as gales or witches, and one such storm moved through the region on November 9th and 10th of 1975, when the Edmund Fitzgerald sank.

The Edmund Fitzgerald departed from Superior, Wisconsin at about 2:30pm on November 9th and was quickly joined by the Arthur M. Anderson, which had departed out of Two Harbors, Minnesota. The Captains of the two ships were aware of an incoming storm and opted to take the safer northern route across Lake Superior to their destinations. The Edmund Fitzgerald took the lead and the Arthur M. Anderson followed at a distance of 10 to 15 miles.

The National Weather Service issued a gale warning at 7pm on November 9th, which was then upgraded to a storm warning in the early morning hours of November 10th. By the early afternoon, winds were gusting at 50 knots (93 km/h) and waves were 3.5 to 5 metres (12 to 16 feet) tall, but these were conditions that the Captains could handle.

The conditions continued to deteriorate throughout the afternoon and at 3:30pm, Captain McSorley of the Edmund Fitzgerald radioed the Arthur M. Anderson to report minor damage to the ship along with a list (a tilt). He asked the other ship to stay close until they got to Whitefish Bay, at the eastern end of Lake Superior, and he would slow down so they could follow closer. Captain Cooper of the Arthur M. Anderson agreed and the two ships continued on their journey.

Reports from the Arthur M. Anderson give us the best insight to the conditions the two ships faced heading into the evening. At approximately 5:20pm, Captain Cooper reported sustained winds of 58 knots (107 km/h) and gusts of 70 knots (130 km/h) along with waves of 5.5 to 7.5 metres (18 to 25 feet). Then, at about 6:55pm, the crew felt a “bump” and the ship lurched due to a gigantic wave crashing into the ship from behind, forcing the bow under water. Just as the ship recovered, a second wave hit. Captain Cooper later said that he watched those two waves head towards the Edmund Fitzgerald ahead of them and he believed that those two waves sank her.

The Arthur M. Anderson made its final contact with the Edmund Fitzgerald at 7:10pm to confirm their position. They were having trouble tracking the lead ship because the waves were so high that they were interfering with radar. The ship kept disappearing and reappearing on radar, but at 7:15pm, it disappeared for the last time. The Arthur M. Anderson tried to contact the Edmund Fitzgerald once again at 7:22pm, but there was no answer. The Edmund Fitzgerald was not seen again until May 20th, 1976, 163 metres (535 feet) below the surface of the lake.


GOOGLE AD (NOT ENDORSED BY INSTANT WEATHER)

Modelled wave heights and directions on lake superior at 7pm, November 10th, 1975. The location of the Edmund Fitzgerald wreck is marked by the red plus, Courtesy of the National Weather Service.

In 2006, a study re-examined the November 1975 storm using modern computer modelling in order to determine wind strength and wave heights at the time of the sinking. According to these models, it’s likely that the waves were at least 7.5 metres (25 feet) tall driven by sustained winds over 45 knots (83 km/h). Unfortunately, the worst conditions from this storm occurred exactly when and where the Edmund Fitzgerald sank.

Three months after the discovery of the doomed ship, Gordon Lightfoot released his hit song, The Wreck of the Edmund Fitzgerald, which has forever memorialized the ship into the hearts and minds of Canadians and Americans alike. The anniversary of the sinking is still honoured every year at the Great Lakes Shipwreck Museum at Whitefish Point. In the ceremony, the recovered bell of the Edmund Fitzgerald is rung 29 times, for each crew member lost, and a 30th time for all others who have been lost to the Great Lakes.


Further Reading:

Hultquist, T.R., Dutter, M.R. and Schwab, D.J. (2006). Reexamination of the 9–10 November 1975 “Edmund Fitzgerald” Storm Using Today's Technology. Bulletin of the American Meteorological Society, 87(5), 607-622. https://doi.org/10.1175/BAMS-87-5-607

https://www.shipwreckmuseum.com/edmund-fitzgerald/

https://www.shipwreckmuseum.com/the-fateful-journey/

https://www.ssedmundfitzgerald.org/storm-and-voyage

https://www.weather.gov/mqt/fitz_fitz

What's in a Name? Choosing the Right Tires to Drive you Through Canadian Winters

Tread patterns of summer, all season and winter tires. Image courtesy of discount tire.

Now that it’s the first week of November, many Canadians are starting to think about putting winter tires on their vehicles. There have been pockets of unseasonable warmth across the country in October and the start of November, the inevitable chill of winter is in the air, and many have already seen snow fall.

While winter tires are recommended throughout the country, they are mandatory in Quebec from December 1st to March 15th, and from October 1st to April 30th on certain British Columbia highways. Additionally, studded tires are allowed almost nationwide, with the exception of residents of Southern Ontario.

Insurance companies across the country offer discounts for installing winter tires as an incentive to encourage drivers to reduce the risk of accidents. So what makes winter tires that much better in the cold and snow than summer tires and where do all season and all weather tires fit into the mix?


GOOGLE AD (NOT ENDORSED BY INSTANT WEATHER)

With the right tools, it can be pretty easy to change your own tires!

Summer Tires

Summer tires are designed to handle both wet and dry road conditions with their wide tread and soft rubber. These tires also usually have deeper grooves that improve traction on wet roads and reduce hydroplaning, making them ideal for the wet spring and summer months.

Winter Tires

Like their name suggests, winter tires have been designed for winter roads. They are made with rubber that stays flexible at temperatures below 7°C (45°F), the magic number at which other tires become stiff and lose traction, greatly reducing their performance. Furthermore, winter tires have different tread patterns that are meant to divert water and slush to the sides, as well as little slits called sipes that increase the overall grip of the tires and helping them maintain contact with icy road surfaces. Over the past several years, tire manufacturers have started to include additional small particles, like crushed glass or walnut shells, that act as little studs on the surface of the tire for extra grip.


Performance of All Season Tires vs Winter Tires with decreasing temperatures. Image courtesy of Discount Tire.

All Season & All Weather Tires

Some people argue that winter tires aren’t necessary if they have all season tires on their vehicle. Unfortunately, this is a slight misnomer because while these tires can handle a bit of cold and snow, they fail to handle heavier snowfalls that are common in Canadian winters. All season tires, unfortunately, sacrifice traction in wet conditions that would be found in summer tires and some of the flexibility and grip seen with winter tires in order for the tread to last longer. Realistically, these should be called 3 season tires as opposed to all season. So while they’re not the best option for winter driving in Canada, all season tires are definitely a better choice than regular summer tires.

All weather tires, not to be confused with all season tires, are a true year-round tire designed to handle Canadian winters. Unlike all season tires, these tires remain soft and flexible well below 7°C. The tread pattern on all weather tires is a combination of all season and winter tires, making them better suited for driving through heavier snow than all season tires. While they still don’t match the performance of a true winter tire, all weather tires are the best option for those who don’t want the hassle of swapping out their tires twice per year or simply do not have the space to store an extra set. Their versatility truly makes all weather tires a middle of the road tire (pun intended) for Canadian drivers.


The three-peak mountain snowflake symbol found on winter and all weather tires. Image courtesy of Canadian tire.

When looking for tires to get you through the winter, it is recommended to chose either a proper winter tire or an all weather tire, so long as it has the three-peak mountain and snowflake symbol on the sidewall. This is an industry standard symbol which indicates that the tire meets strict regulations for winter performance; becoming mandatory on all winter tires beginning in 2018, transitioning away from just using the M+S (Mud and Snow) designation.


Further Reading

https://www.canadiantire.ca/en/how-to/automotive/how-to-choose-winter-tires.html

https://www.continental-tires.com/ca/en/tire-knowledge/winter-tire-laws-in-canada/

https://www.continental-tires.com/ca/en/tire-knowledge/winter-tire-markings/

https://www.discounttire.com/learn/tires-below-45

https://www.discounttire.com/learn/winter-summer-allseason

Note: The author formerly received payments from “Big Tire” however, this article was not funded.

Toronto’s Storm of the Century: Remembering Hurricane Hazel 70 Years Later

Overhead view of Raymore drive in Toronto following hurricane hazel, courtesy of Toronto and Region Conservation Authority.

It was on this day 70 years ago, in 1954, that the now infamous Hurricane Hazel hit Southern Ontario and caused catastrophic damage to Toronto. It is considered the area’s worst natural disaster and has shaped development for years to come. The storm produced winds up to 124km/h and dumped over 200mm of rain in just 24 hours; left 81 people dead and over 4000 families homeless, 1868 of those families in Toronto; and caused over $135 million in damages in Ontario ($1.5 billion by today’s standards). Hazel changed the way conservation authorities operate across Ontario and those impacts are still felt to this day.


GOOGLE AD (NOT ENDORSED BY INSTANT WEATHER)

Hurricane Hazel's Path, October 14-15, 1954, Courtesy of the National Weather Service.

Hurricane Hazel was first identified on October 5, 1954 by a Hurricane Hunters aircraft from Puerto Rico which located it just east of the island nation of Grenada in the West Indies. The plane estimated that the storm was already a Category 2 hurricane with winds estimated at 160km/h, but this value was more recently revised to 105km/h, making Hazel a Tropical Storm at the time, during reanalysis of former hurricane seasons by NOAA. Hazel intensified following the Hurricane Hunters mission and it made its first landfall over Grenada on the evening of the 5th as a Category 1 hurricane with winds estimated at 120km/h.

From there, Hazel tracked west-northwestward off the northern coast of Venezuela for the next few days, gaining strength along the way. Late on October 9th, Hazel gained Major Hurricane status with winds estimated at 195km/h. The next day, the storm made a sharp turn and started churning northeastward, where it eventually made two separate landfalls on Haiti’s west coast, initially over the Tiberon Peninsula as a Category 3 with winds estimated at 195km/h in the pre-dawn hours on the 12th and then as a Category 2 with estimated winds of 160km/h later that same evening over the northern peninsula. Hurricane Hazel killed up to 1000 people in Haiti and devastated the economy, destroying 40% of the nation’s coffee trees and 50% of the cacao crop.

Following its second landfall in Haiti, Hurricane Hazel curled northwestward and made its fourth total landfall in Inagua, an island in the Bahamas, less than 18 hours later on the morning of the 13th. The storm maintained its Category 2 strength between the two landfall occurrences, hitting the Bahamas with winds estimated at 160km/h.

Beyond the Bahamas, Hazel gained speed and reintensified, becoming a Category 4 hurricane on the evening of October 14th. Just before noon on October 15th, Hazel made its fifth and final landfall near the border of North Carolina and South Carolina as a Category 4 hurricane with sustained winds of 215km/h and gusts up to 240km/h. Hazel quickly transitioned to a post-tropical cyclone, but it maintained hurricane-force winds as it quickly pushed through D.C., Pennsylvania, New York, and towards the Canadian border. The storm killed 95 Americans and caused over $1.5 billion of damage by today’s standards.


GOOGLE AD (NOT ENDORSED BY INSTANT WEATHER)

Surface Chart from 8:3pm ET showing the location of Hazel over Southern Ontario, Courtesy of the National Weather Service.

As Hazel made its way northward through the States, Canadian authorities began issuing warnings to the general public, but most people didn’t know how to prepare for a hurricane. The storm began to weaken over the Allegheny Mountains in West Virginia and meteorologists expected it to dissipate, however the opposite happened. Instead, Hazel encountered a low-pressure system over western New York and intensified just before it crossed into the Niagara Peninsula.

Hurricane Hazel was a post-tropical Category 1 storm that brought severe wind gusts of up to 124km/h to a large portion of Southern Ontario on October 15th, but the winds were not the main concern from the storm. By the evening rush hour, the winds began to die down, but according to Chief Meteorologist Brian Turnbull, the worst of the storm was yet to come. The days leading up to Hazel’s arrival were quite wet so when the heavy rainfall began in the late afternoon, it didn’t take long for flooding to begin. Significant deforestation and development on the saturated flood plains across Toronto could not contain the over 200mm of rain that fell in 24 hours which resulted in many rivers overtopping their banks, with water levels rising by up to 8 metres. The Humber River, in particular, became a deadly torrent through the city, washing away roads, bridges, and entire homes. Overall, the storm dumped 181.6 billion litres of rain on the City of Toronto.

In total, 81 people lost their lives from Hurricane Hazel, mostly in the west end of Toronto. Across Southern Ontario, approximately 4000 families lost their homes, 1868 of which were in Toronto. Raymore Drive was hit particularly hard with 14 homes being washed away, killing 35 people. Fortunately, the death toll could have been much worse if not for the heroics displayed by many police officers, firefighters, and ordinary citizens who worked tirelessly trying to save those who became stranded. Sadly, five firefighters lost their lives when trying to rescue trapped motorists.

The effects of Hurricane Hazel were felt beyond Toronto. Significant flooding was experienced in communities as far west as London and north to Georgian Bay as the storm progressed northwards to James Bay, where it eventually dissipated.

Members of the Harbour Patrol Rescue a man from the Don River, courtesy of the Canadian Encyclopedia.


GOOGLE AD (NOT ENDORSED BY INSTANT WEATHER)

In the aftermath of Hurricane Hazel, many changes were made to conservation authorities across Ontario, especially in the Greater Toronto Area.

An intensive plan was put in place by conservation authorities, along with both the municipal and provincial governments, for flood control and water conservation in order to limit loss of life and property from future extreme weather events. As part of this plan, flood control facilities were inspected, upgraded, or built alongside additional dams and reservoirs to control and monitor water levels. A flood forecasting and warning system was also a large component to the plan.

An amendment was made to the Conservation Authorities Act that allowed individual conservation authorities to obtain and control vulnerable areas to be used for conservation and recreation. As a result, many homes were cleared from low-lying areas and greenbelts were created within watersheds. This included the expropriation of most remaining properties on Raymore Drive by the Metro Toronto and Region Conservation Authority which was turned into parkland, now called Raymore Park.

As we look back on the anniversary of this tragic event, we want to remember those that were lost and all of the efforts that have been put in place since to prepare for future extreme weather events. The City of Toronto has seen many flooding events since Hurricane Hazel, and it will continue to do so for many year. However, major floods in 2013 and more recently in 2024 show that more work still needs to be done.

The G. Ross Lord Dam, One of the Many Flood Control Measures in Place Across Toronto, Courtesy of the Toronto and Region Conservation Authority.


Sources:

https://www.aoml.noaa.gov/hrd/hurdat/hurdat2.html

https://www.heritage-matters.ca/articles/hurricane-hazel-50-years-later

https://www.heritagetrust.on.ca/pages/programs/provincial-plaque-program/provincial-plaque-background-papers/hurricane-hazel

https://www.hurricanehazel.ca/ssi/evolution_flood_control.shtml

https://www.thecanadianencyclopedia.ca/en/article/toronto-feature-hurricane-hazel

https://www.thecanadianencyclopedia.ca/en/article/hurricane-hazel

https://www.trca.ca/news/hurricane-hazel-70-years/

https://www.weather.gov/mhx/Oct151954EventReview

Storm of the Century for Tampa and Central Florida; Catastrophic Hurricane Milton Will Make Landfall Tonight

Satellite Image of Hurricane Milton from October 8th at 10:30PM EDT, Courtesy of Colorado State University.

Hurricane Milton managed to maintain its status as a Category 5 hurricane overnight and has since been downgraded to a still catastrophic Category 4. Milton has finally started to encounter some shear that began to change its structure and will cause the storm to weaken. The shear is expected to increase throughout the day, weakening the storm further, but it is still expected to be a powerful Category 3 hurricane upon landfall later tonight. Current projections have landfall occurring at around 1am with maximum sustained winds of 125 mph (201 km/h).

There have also been continued southward wobbles in Milton's track and this has pushed the potential landfall location further south. The margin of error is approximately 20 miles at this point, so the exact location of landfall is starting to become a bit clearer. Regardless of where the storm eventually makes landfall, the shear will cause the storm to grow and the devastating impacts will be widespread. This is the first hurricane to directly impact the Tampa area since 1921, making Hurricane Milton the storm of the century for the region.


GOOGLE AD (NOT ENDORSED BY INSTANT WEATHER)

Reflectivity from the Tampa Bay Radar Station on October 9th at 11:40AM EDT.

The eye of the hurricane is now visible on both Key West and Tampa Bay radars and we've already begun to see significant rainfall moving inland in Central Florida. Current rainfall totals for the Tampa area are in the 1-2 inch (25-50mm) range, but with the heaviest bands of rain just starting to come ashore, these numbers will jump.

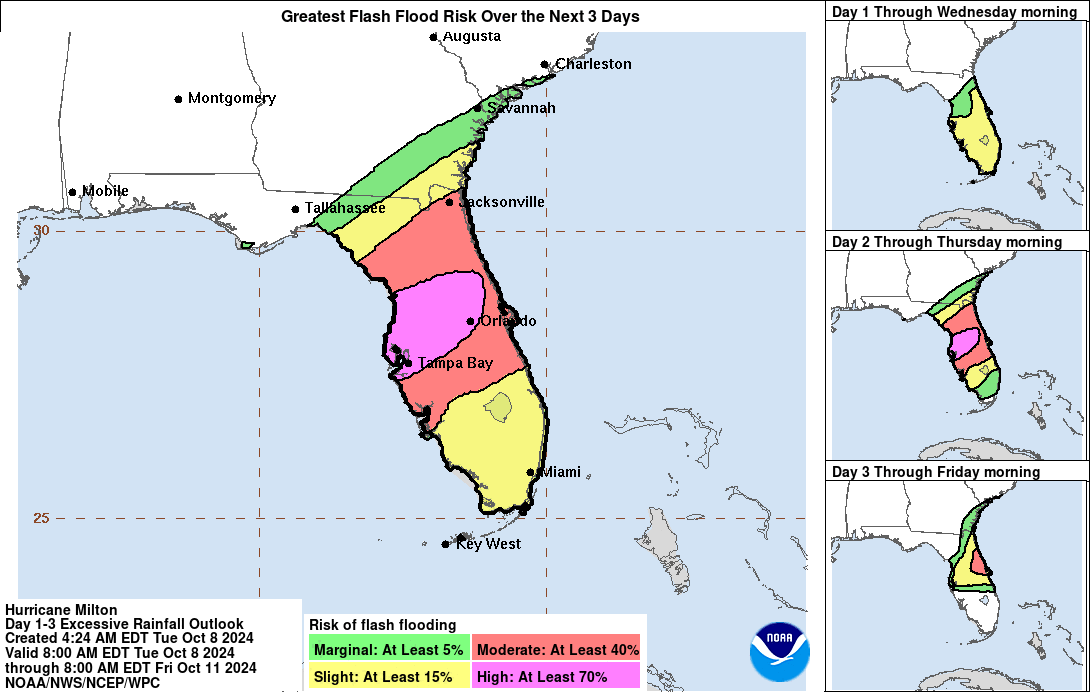
Widespread flooding remains a major concern across central and northern portions of the Florida Peninsula, with localized rainfall totals potentially reaching 18 inches (457 mm). These heavy rains will push far inland and elevate the risk of flash flooding over a large part of the state, especially in low-lying areas and along rivers. The Weather Prediction Center (WPC) continues to forecast a High Risk (their highest level) for flash flooding across a large swath of Central Florida that includes Tampa and Orlando.

We've also seen several tornado warnings and confirmed tornadoes south of Lake Okeechobee. Tornadoes are a major threat when hurricanes approach shore from the many imbedded thunderstorms and the potential for more tornadoes will continue into the afternoon and expanding northward with the overall motion of the hurricane.


GOOGLE AD (NOT ENDORSED BY INSTANT WEATHER)

Tropical storm-force winds are started to make their way over land with the rain this morning and they will gradually spread further inland throughout the day as the storm makes its final approach and the increased shear causes the wind field to grow. The area of hurricane-force winds will also become larger, but since they are found closer to the eye, they won’t be felt inland until closer to landfall.

The continued southern shift that's been seen in Hurricane Milton's track has also shifted where the greatest storm surge is expected. The greatest peak storm surge of 10-15ft is now forecasted along the coast from Anna Maria Island to Boca Grande. The forecast for Tampa Bay has been downgraded to 8-12ft, but this is still a life-threatening amount of water.

With a little over 12 hours until landfall, there is very little time left for those in the path to make their final preparations. If you or your loved ones are in the storm’s potential path, it’s crucial to stay informed, heed evacuation orders if they are issued, and follow any directives from local emergency personnel. We will continue to provide updates throughout the day as Milton makes its final approach.


Peak Storm Surge Forecast in FLorida for Hurricane Milton, Courtesy of The National Hurricane Center.

Florida Braces for Catastrophic Landfall of Hurricane Milton; Potential to be the Most Destructive Hurricane on Record for the State

Satellite Image of Hurricane Milton from October 8th at 2:21PM EDT, Courtesy of National Hurricane Center.

Following its almost unprecedented intensification from a Tropical Storm to a Category 5 hurricane and becoming the 5th most intense Atlantic hurricane on record, Milton’s development was stunted overnight while undergoing an eyewall replacement cycle. During this, the inner structure of the storm changed significant, with the eye filling in and the wind field expanding. The peak winds fluctuated and Milton was downgraded to a Category 4 hurricane this morning.

With the eyewall replacement complete, the eye cleared and shrunk in size, marking the possibility it might regain some of its slight loss in strength and achieve Category 5 status once again. The latest Hurricane Hunter recon mission estimates that Milton is just shy of the threshold of becoming a Category 5 hurricane with maximum sustained winds of 155 mph (250 km/h). However, continued structural changes over the next 24 hours will result in further fluctuations in strength.


GOOGLE AD (NOT ENDORSED BY INSTANT WEATHER)

Forecast Track for Hurricane Milton, Courtesy of The National Hurricane Center.

Hurricane Milton continues its offshore passage of the Yucatan Peninsula, where it has brought significant damage to coastal areas. The storm has already made its predicted turn and begun moving northeastward into the heart of the Gulf, where it will increase its forward speed bringing it into Central Florida.

There has been very little change in the official forecast track from the National Hurricane Center (NHC), aside from the possibility that landfall might occur just south of Tampa Bay. This slight change is of little consequence because even at 24-36 hours out, the NHC forecasts have of a margin of error 60-70 miles so it is still difficult to pinpoint exactly where landfall will occur. Furthermore, Milton and its wind field are still projected to grow in size as the storm encounters vertical wind shear ahead of landfall. The area of hurricane and tropical storm-force winds is expected to double in size, spreading the threats of life-threatening surge, heavy rains, and destructive winds far beyond the forecast cone.

The NHC’s storm surge forecast for the Anclote River to Englewood, including Tampa Bay, has been increased to 10-15ft and could be double that from Hurricane Helene two weeks ago. With the area still recovering from storm surge damage that resulted from Helene, large piles of debris can be found all along the coast, posing a very unique threat. Not only will some of the debris get washed back inland with the storm surge, the hurricane-force winds could easily turn these remnants into dangerous projectiles when the storm hits.


GOOGLE AD (NOT ENDORSED BY INSTANT WEATHER)

In addition to the threat of storm surge and intense winds, central and northern portions of Florida Peninsula could see 5-12 inches (127-305 mm) of rainfall, with localized totals potentially reaching 18 inches (457 mm). These heavy rains will push far inland and elevate the risk of flash flooding over a large part of the state, especially in low-lying areas and along rivers. The Weather Prediction Center (WPC) has issued a High Risk (their highest level) for flash flooding across a large swath of Central Florida that includes Tampa and Orlando.

After landfall, Milton is expected to track across the Florida Peninsula and emerge into the Atlantic, where it will briefly remain a hurricane before transitioning into a post-tropical storm. However, the impacts to Florida and surrounding areas will be significant long before the storm weakens.


Flash Flood Forecast in Florida from Hurricane Milton, Courtesy of The National Hurricane Center.

Milton’s rapid intensification has been fuelled by its movement through an area of deep, warm waters, with sea surface temperatures exceeding 28°C, providing ample energy for the storm. Additionally, low wind shear in the region has allowed the hurricane to strengthen unhindered. Thankfully, we began to see that development stall overnight with the eyewall replacement cycle. As it continues to approach Florida, Milton is still expected to encounter an area of shear that will weaken it further, but it will still be a powerful hurricane at landfall. The NHC forecast maintains that it could make landfall as a Category 3 hurricane, with maximum sustained winds of 125 mph (201 km/h). However, they have stated that this projection is on the high end of model guidances so there is the possibility of an adjustment to this forecast in the next 24 hours.


GOOGLE AD (NOT ENDORSED BY INSTANT WEATHER)

The entire Florida Peninsula is now under a Tropical Storm or Hurricane Warning. Residents in the projected path are being urged to finalize their preparations while there is still time. Tropical storm-force winds are expected to arrive as early as tomorrow morning, with landfall projected overnight Wednesday. While uncertainty remains regarding Milton’s exact landfall location and strength, the potential for widespread heavy rainfall, destructive winds, and life-threatening storm surges is significant.

If you or your loved ones are in the storm’s potential path, it’s crucial to stay informed, heed evacuation orders if they are issued, and follow any directives from local emergency personnel. We will continue to provide updates as more information becomes available, so stay tuned. Your safety is the priority as Hurricane Milton approaches.


Forecast Track and Intensity of Hurricane Milton with Sea Surface Temperatures, courtesy of Tomer Burg.

Milton Rapidly Intensifies into Dangerous Category 5 Hurricane; Threatens to Slam into Tampa Bay, Florida on Wednesday

Satellite Image of Hurricane Milton from October 7th at 11:59am EDT, Courtesy of Colorado state university.

In a remarkable and alarming turn of events, Hurricane Milton has rapidly intensified from a Category 1 to a Category 5 hurricane within just 18 hours, marking one of the most rapid intensifications on record in the Atlantic. Only Hurricane Wilma intensified faster, strengthening in just 12 hours back in 2005. Such an extreme escalation underscores the potential danger of this storm as it continues to grow in strength.

Data gathered by Hurricane Hunter aircraft earlier this morning estimated that Milton’s maximum sustained winds were around 160 mph (257 km/h), making it the second hurricane this season to reach Category 5 intensity, following Hurricane Beryl in July. However, more recent data now indicates that Milton’s winds have increased even further to 175 mph (282 km/h), with a minimum central pressure of 911mb, making it the strongest Atlantic hurricane since Dorian in 2019. These numbers highlight just how powerful Milton has become in such a short span of time.


GOOGLE AD (NOT ENDORSED BY INSTANT WEATHER)

Forecast Track for Hurricane Milton, Courtesy of The National Hurricane Center.

Interestingly, Hurricane Milton did not follow its projected almost directly eastward path overnight. Instead, the storm has wobbled southeastward, bringing it much closer to the Northern Yucatan Peninsula than initially forecasted. As a result, Mexican authorities have issued Hurricane Warnings, anticipating hurricane-force winds to impact the region today. The shift in track has led to a stronger storm approaching the Yucatan, further complicating forecasts and increasing the potential for damage along the coast.

This unexpected change in Milton’s path has also influenced weather models and the official forecast track from the National Hurricane Center (NHC). Despite continued uncertainty regarding Milton’s precise path, the storm is now forecasted to make landfall further south than originally thought, with the Tampa Bay area now directly in its sights. The NHC predicts that Milton will curve northeastward later this afternoon, with an increase in forward speed, leading to a likely landfall on Wednesday evening.

Unfortunately, this is a worst-case scenario for Tampa Bay, as the region is still recovering from storm surge damage caused by Hurricane Helene less than two weeks ago. Now, with Milton’s stronger winds and greater storm surge, the area faces an even more dangerous situation. With plenty of loose debris still scattered along the coast, the hurricane-force winds could easily turn these remnants into dangerous projectiles when the storm hits. The NHC is currently forecasting storm surges of 8-12 feet from the Anclote River to Englewood, including Tampa Bay itself. Due to Milton’s angle of approach, the surge could be more severe than what was seen with Helene, posing an even greater threat to life and property.

In addition to storm surge concerns, much of the Florida Peninsula and the Florida Keys could see 5-10 inches (127-254 mm) of rainfall, with localized totals potentially reaching 15 inches (381 mm). These heavy rains elevate the risk of flash flooding, especially in low-lying areas and along rivers.

After landfall, Milton is expected to track across the Florida Peninsula and emerge into the Atlantic, where it will briefly remain a hurricane before transitioning into a post-tropical storm. However, the impacts to Florida and surrounding areas will be significant long before the storm weakens.


GOOGLE AD (NOT ENDORSED BY INSTANT WEATHER)

Peak Storm Surge Forecast in FLorida for Hurricane Milton, Courtesy of The National Hurricane Center.

Milton’s rapid intensification has been fuelled by its movement through an area of deep, warm waters, with sea surface temperatures exceeding 28°C, providing ample energy for the storm. Additionally, low wind shear in the region has allowed the hurricane to strengthen unhindered. However, as Milton moves further north, it is expected to encounter stronger wind shear, which should start to weaken the storm after about 24 hours as a Category 5 hurricane. Though this shear may reduce Milton’s intensity, it could also cause the storm to expand, spreading its damaging winds and heavy rains over a much larger area. The current NHC forecast suggests that Milton could make landfall as a Category 3 hurricane, with maximum sustained winds of 125 mph (201 km/h).


GOOGLE AD (NOT ENDORSED BY INSTANT WEATHER)

States of Emergency remain in place for much of Florida, with the exception of the Panhandle. Residents in the projected path are being urged to finalize their preparations while there is still time. Tropical storm-force winds are expected to arrive as early as overnight Tuesday and Wednesday morning, with landfall projected for Wednesday evening. While uncertainty remains regarding Milton’s exact landfall location and strength, the potential for widespread heavy rainfall, destructive winds, and life-threatening storm surges is significant.

If you or your loved ones are in the storm’s potential path, it’s crucial to stay informed, heed evacuation orders if they are issued, and follow any directives from local emergency personnel. We will continue to provide updates as more information becomes available, so stay tuned. Your safety is the priority as Hurricane Milton approaches.


Forecast Track and Intensity of Hurricane Milton with Sea Surface Temperatures, courtesy of Tomer Burg.

Florida Braces for Second Major Hurricane Hit in Less Than Two Weeks With Milton; Tampa Area Could See Life-Threatening Storm Surge

Forecast Track for Hurricane Milton, Courtesy of The National Hurricane Center.

After monitoring a disturbance in the Western Caribbean and Gulf of Mexico for over a week, the National Hurricane Center (NHC) confirmed the formation of Tropical Depression 14 in the Western Gulf, which quickly strengthened into Tropical Storm Milton by yesterday afternoon. Since then, Milton has continued to strengthen, with both satellite and aircraft reconnaissance data indicating a sharp increase in intensity. As of the latest update, Milton has been upgraded to a Category 1 hurricane, with maximum sustained winds of 80 mph (129 km/h).

What makes this storm particularly concerning is its projected path, which takes it directly toward the Tampa Bay area. If this forecast holds, Milton will be the first hurricane to make landfall in Tampa since 1996. However, what’s raising even more alarm is the potential for a greater storm surge in the Tampa area than what was seen with Hurricane Helene less than two weeks ago. Milton’s angle of approach is expected to produce a more severe storm surge in the region, which could compound the impact.

While the formation of hurricanes in the Western Gulf of Mexico isn’t particularly common, it’s certainly not unprecedented, especially given the exceptionally warm water temperatures the basin is currently experiencing. These conditions are ripe for storms like Milton to intensify quickly.


GOOGLE AD (NOT ENDORSED BY INSTANT WEATHER)

As of now, Hurricane Milton is forecasted to track almost due east today and tomorrow before turning northeast late on Monday. It will remain offshore of the Yucatan Peninsula, but close enough to prompt Tropical Storm Watches and Warnings in the region. The storm is expected to pick up speed on Tuesday and Wednesday, continuing along its northeastward track, as it heads toward Florida, with landfall anticipated late Wednesday morning or early afternoon.

There’s still significant uncertainty about the storm’s exact path, especially where it will ultimately make landfall in Florida. Current model forecasts, along with the official NHC projection, suggest that Milton will make landfall north of Tampa, near the Crystal River area. If this track holds, it may spare Tampa from the worst of Milton’s winds, but the region will still face heavy rainfall and significant storm surge. Early estimates suggest up to 6 inches (152 mm) of rain and a storm surge that could reach as high as 10 feet in Tampa Bay.

It’s important to note that track forecasts this far out still have a margin of error of around 100 miles, so these projections could change over the coming days. As more data comes in, the forecast will likely be refined.

Following making landfall, Milton is expect to cross the Florida Peninsula and into the Atlantic Ocean, where it will continue briefly as a hurricane before transitioning into a post-tropical storm.


Model Forecast Tracks for hurricane Milton, Courtesy of Tomer Burg.

Milton is currently moving through an area of warm, deep waters, with sea surface temperatures above 28°C, which are providing ample fuel for the storm’s rapid intensification. Additionally, there is very little wind shear in the area, allowing Milton to strengthen even faster. Meteorologists are drawing comparisons to the rapid intensification recently seen with Hurricane Helene.

By late Monday, Hurricane Milton is expected to become a Major Hurricane, reaching at least Category 3 status. There’s still some disagreement among weather models about how strong Milton will ultimately become. Regional hurricane models are predicting a more intense storm than global models, with some even forecasting Milton to briefly reach Category 5 strength. However, these models also show that the storm may weaken slightly before making landfall, thanks to increasing shear near the Florida coastline. This shear, while helping to weaken Milton, could also cause the storm to grow in size, spreading its impacts over a much larger area.

The current NHC forecast estimates Milton will make landfall as a Category 3 hurricane, with maximum sustained winds in excess of 111 mph (178 km/h). However, the NHC has acknowledged that their forecast may be conservative, given the model predictions.


GOOGLE AD (NOT ENDORSED BY INSTANT WEATHER)

In anticipation of Milton’s arrival, States of Emergency have already been declared across most of Florida, with the exception of the Panhandle. Residents in the projected path are being urged to begin making preparations, as storm surge and hurricane watches are expected to be issued later today and overnight. Emergency officials are warning that this could be Florida’s largest evacuation effort since 2017, with millions potentially in the storm’s path.

Hurricane Milton’s landfall is still a few days away, providing enough time for residents in the affected areas to make necessary preparations. While Milton’s exact track and strength at landfall remain uncertain, the threat of heavy rainfall, damaging winds, and life-threatening storm surges is significant.

If you or your loved ones are in the storm’s potential path, it’s crucial to stay informed, heed evacuation orders if they are issued, and follow any directives from local emergency personnel. We will continue to provide updates as more information becomes available, so stay tuned. Your safety is the priority as Hurricane Milton approaches.


Forecast Intensity from different models for hurricane Milton, courtesy of Tomer Burg.

After Devastating the Southeastern United States, Is Helene Coming to Canada?

Satellite Image of tropical storm Helene from September 27th at 10:21am EDT, Courtesy of Colorado state university.

After making landfall as a major Category 4 Hurricane late last night and its subsequent path of destruction across Florida, Georgia, and the Carolinas, many in Ontario are wondering if we will feel the impacts of Helene closer to home over the weekend. Helene has since weakened to a tropical storm, but it remains a massive storm with far reaching impacts.


GOOGLE AD (NOT ENDORSED BY INSTANT WEATHER)

Helene has made its way well inland over the past 12 hours, with its low pressure centre currently situated over the Southern Appalachians. Despite still being located so far south, light cloud cover from the storm has made its way into Southwestern Ontario and the Niagara Region. This cloud cover has been responsible for a fabulous display of sun halos across the region this morning!

The storm will continue to gradually track to the northwest this afternoon before stalling out over the Tennessee Valley overnight, where it will encounter and merge with another low. The lack of motion in the storm will unfortunately bring even more rainfall and further exacerbate the extreme flooding and landslide situation already being seen throughout the Southern Appalachians and bring that into the Ohio and Tennessee Valleys.

In Ontario, the cloud cover from Helene will push deeper into the province this afternoon and light rain can be expected in Southwestern Ontario, from Windsor through London and into Niagara, beginning overnight tonight and continuing through the weekend. Much of the rest of Southern Ontario can expect a dreary weekend as the cloud cover settles in.

The storm will actually travel in a loop, known as the Fujiwhara Effect, while it merges with the second low and by Sunday, it is expected to finally start moving eastward towards the Atlantic and then northeastward along the Eastern Seaboard, where it expected to begin to dissipate.


Forecast Tracks from different models for Helene, Courtesy of Tomer Burg.

"Catastrophic and Potentially Unsurvivable" Major Hurricane Helene Set to Make Landfall in Florida Late Thursday

Satellite Image of Hurricane Helene from September 26th at 2:02Pm EDT, Courtesy of Tropical Tidbits.

Hurricane Helene continued its intensification overnight, strengthening to a Category 2 Hurricane this morning and then to a Category 3 Hurricane this afternoon, with a clearly formed eye and estimated sustained wind speeds of 120mph (195km/h). Tropical storm-force winds are already being felt across Southwest Florida along with storm surge causing inland flooding in coastal communities. The storm will continue to strengthen throughout the day and pick up speed as it makes its final approach for landfall along the Big Bend Coast as a Major Hurricane.


GOOGLE AD (NOT ENDORSED BY INSTANT WEATHER)

There has been little change to the forecast track from the National Hurricane Center (NHC) over the last 24 hours. Hurricane Helene made its projected north-northeastward turn and it will continue along that track before making a final turn northward this afternoon before landfall later this evening.

While the exact location of landfall remains unclear, it appears that will occur in Apalachee Bay. The NHC has stated that in comparison to previous hurricanes in the Gulf of Mexico in the past decades, Helene is on the larger size and as such, its impacts will be very widespread, especially on the east side of the eye. While the massive wind field will bring tropical storm-force winds across the entire state of Florida, hurricane-force winds will be within the eyewall, along the Big Bend Coast, arriving slightly ahead of landfall this evening. These devastating hurricane-force winds are expected to be at least 120mph (195km/h) sustained with even stronger gusts expected.

Inundating rainfall causing widespread flooding is also a major concern with Hurricane Helene across Florida with over 5 inches (127mm) of rain expected along the Big Bend Coast and 2 inches (51mm) along the rest of the Gulf Coast of Florida, with lesser amounts further inland. Rainfall totals in the Apalachicola region could easily exceed 8 inches (203mm).

Along with intense winds and flooding rainfall, the biggest threat will be, to quote the NHC “catastophic and potentially unsurvivable storm surge”, particularly for the Apalachee Bay. The storm surge has already started to appear throughout the entire Florida Gulf Coast and the water levels will continue to increase as Hurricane Helene makes its final approach. Peak storm surge levels exceeding 10ft are expected from Apalachicola to Chassahowitzka and up to 20ft is possible from Carrabelle to Suwannee River.

These factors all combined have prompted widespread Hurricane and Tropical Storm Warnings, evacuations, and States of Emergencies throughout the entire state of Florida and beyond.


Forecast Track for Hurricane Helene, Courtesy of The National Hurricane Center.

With the speed and strength that Hurricane Helene will continue to gain, its impacts will be felt deep inland into the Southern Appalachians with damaging winds and intense rainfall.

Tropical storm-force winds are expected throughout Georgia and into the higher terrains of the mountains which will easily bring down trees and power lines, resulting in widespread power outages, as well as damage to property.

The Blue Ridge Mountains and Piedmont Region of Northern Georgia, Eastern Tennessee, and the Western Carolinas are also possibly looking at receiving up to 15 inches (381mm) of rain by the end of the weekend as the storm is expected to stall beginning late Friday over the Tennessee Valley. This much rain will bring a high risk of urban and flash flooding and landslides across the region. Meteorologists have already started to compare this to the 1916 flooding event in the Asheville, South Carolina area and impacts are expected to be greater than those from Tropical Storm Fred in 2021 and Hurricanes Frances and Ivan in 2004.


GOOGLE AD (NOT ENDORSED BY INSTANT WEATHER)

Helene will remain in an ideal environment for continued strengthening as it makes its final approach before landfall. It’s still located in an area with relatively low shear, strong upper-level divergence, as well as 30°C sea surface temperatures and warmth that extends deep below the surface. These conditions will allow the storm to further intensify from its current strength to a like high-end Category 3 Hurricane with isolated Category 4 level wind gusts.

There is still a bit of time before the storm hits to take necessary precautions to protect life and property. If you or your loved ones are in the path of the storm, please heed all directives from emergency personnel and stay safe!


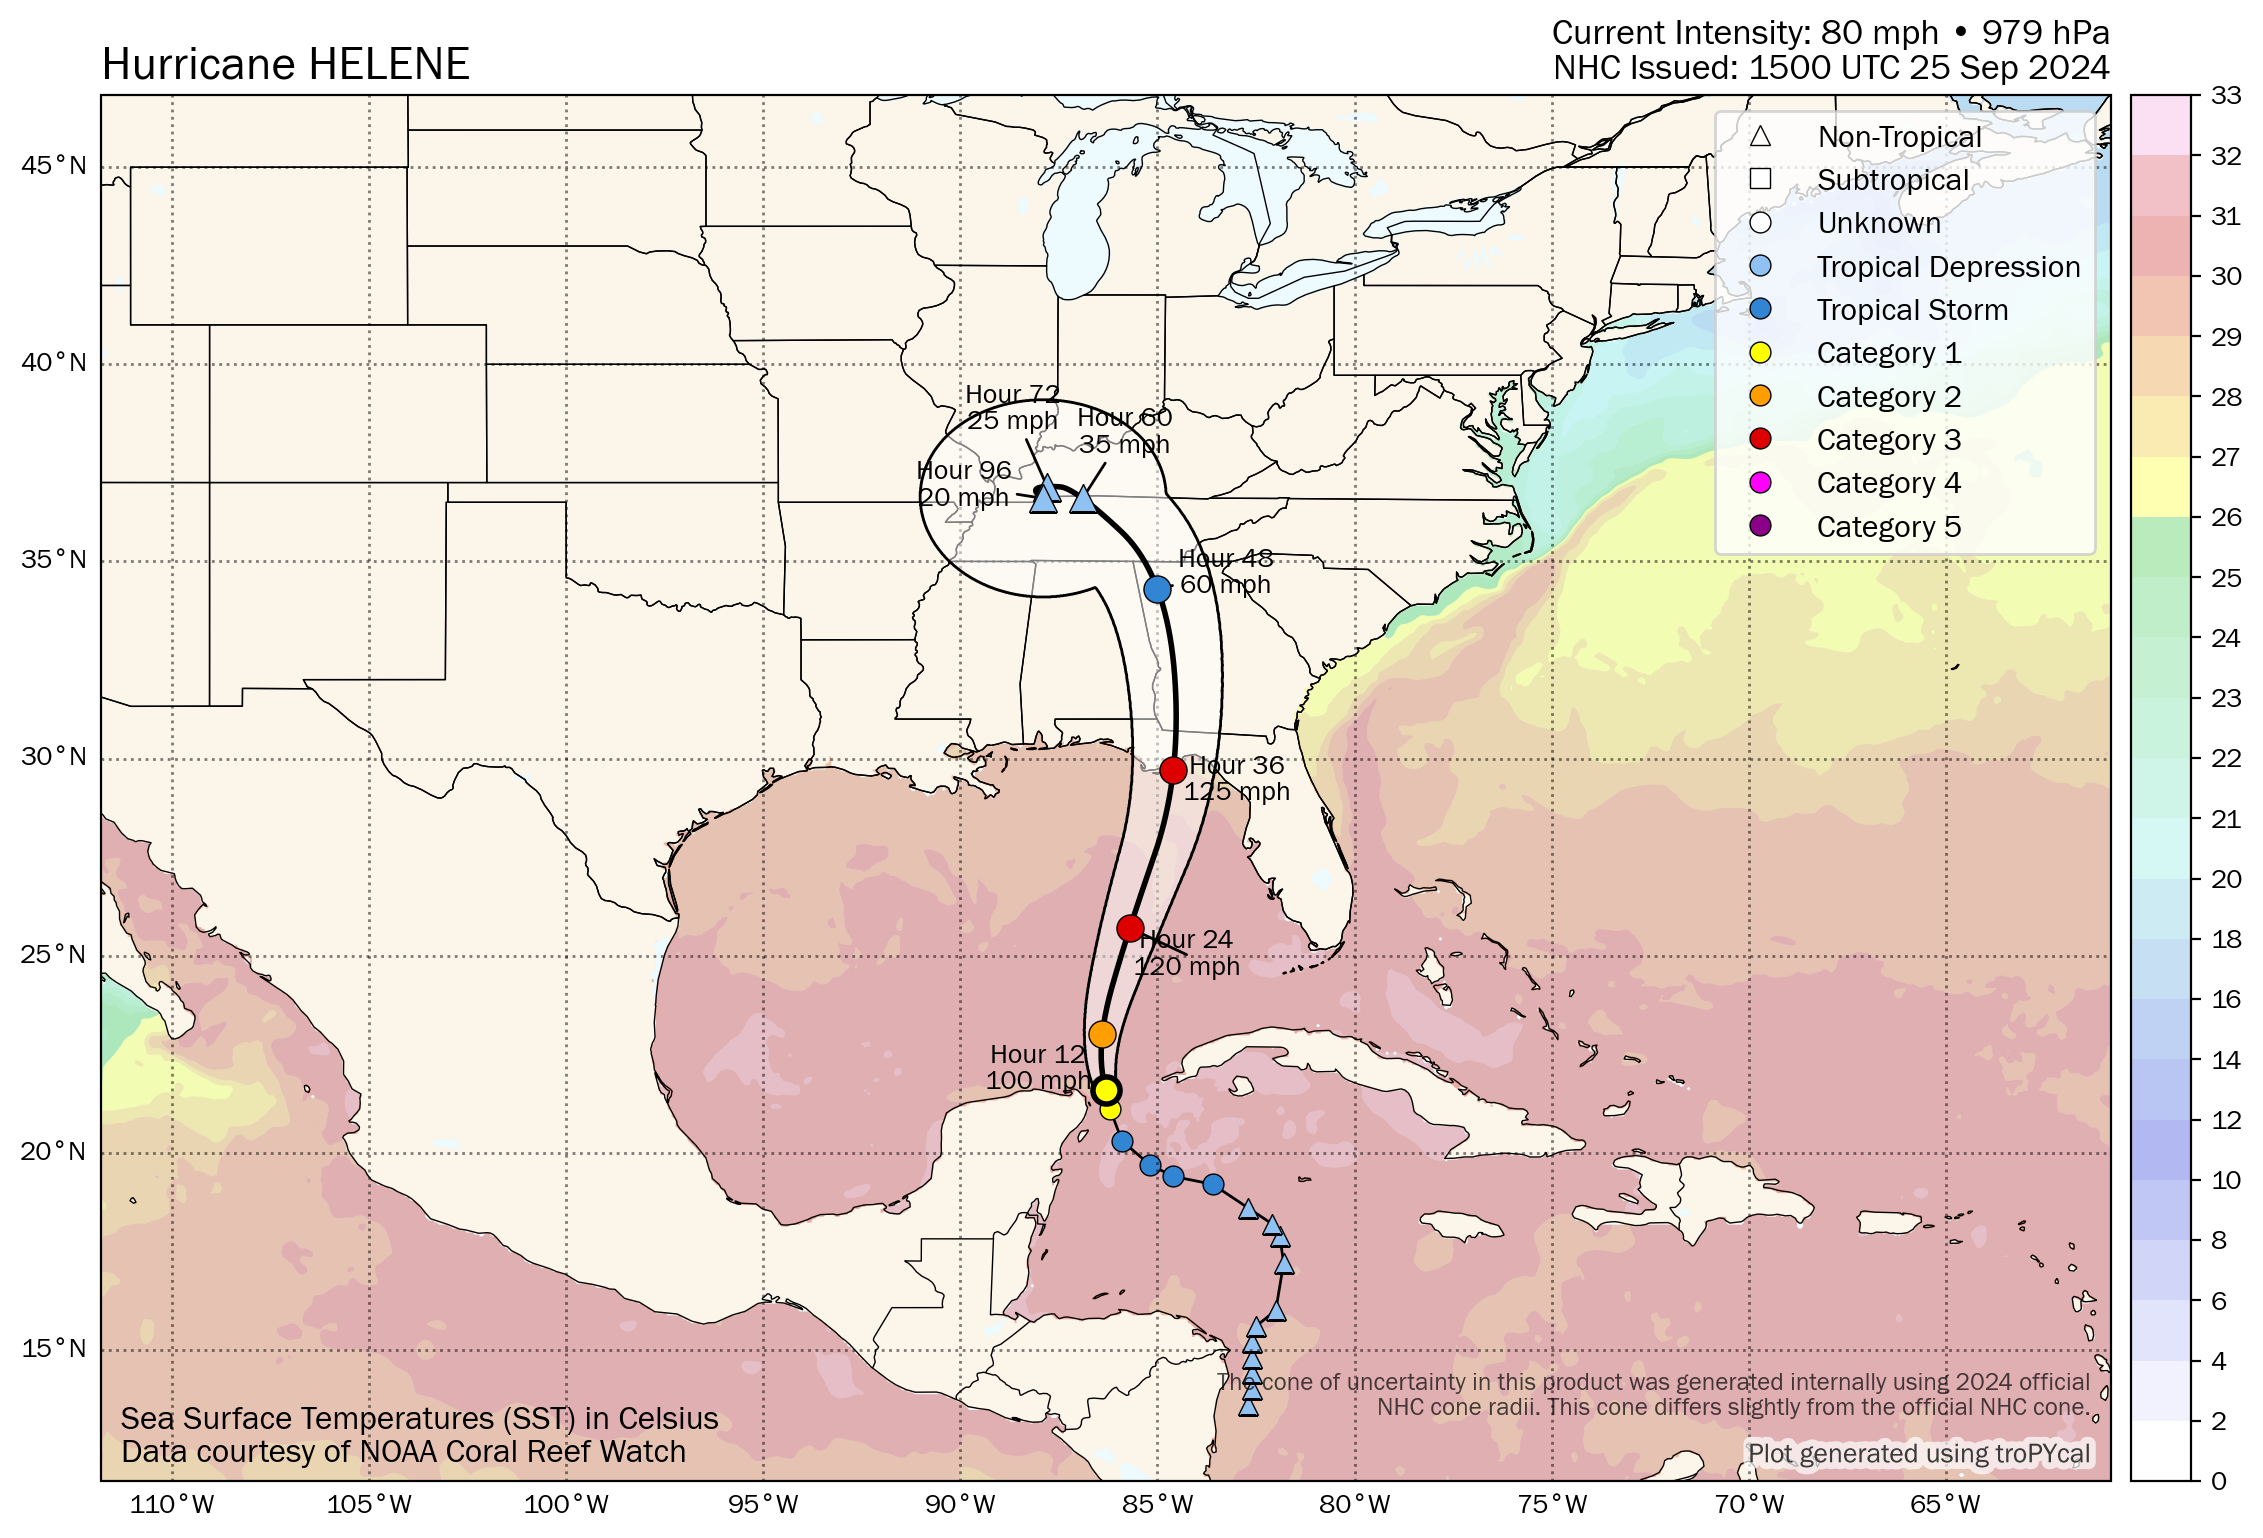
Forecast Track and Intensity of Hurricane helene with Sea Surface Temperatures, courtesy of Tomer Burg.

Rapid Intensification of Helene to a Major Hurricane Expected in the Gulf as it Approaches Florida

Satellite Image of Hurricane Helene from September 25th at 11:26Am EDT, Courtesy of Colorado State University.

Tropical Storm Helene became a Category 1 Hurricane this morning as it continues to track offshore of the Yucatan Peninsula with maximum flight-level wind gusts measured at 81 knots (93mph or 150km/h) by recon flights. Based on this data, it is estimated that the maximum surface winds are 70 knots (81mph or 130 km/h). This is only the beginning of the strengthening of this storm as it is expected to rapidly intensify over the next 24 hours into a major Category 3 Hurricane as it bears down on the Florida Panhandle and Big Bend Coast.


GOOGLE AD (NOT ENDORSED BY INSTANT WEATHER)

The latest forecast track from the National Hurricane Center (NHC) shows that Helene is expected to turn northward and then north-northeastward later today and it will maintain that track as it makes landfall in Florida as a Major Hurricane.

At this point, it is still a bit too early to predict the exact location that Helene will make landfall along the Florida coast, but given the sheer size of the storm, the impacts will be widespread across the state. The storm has a massive wind field and tropical storm-force winds are already pushing their way into the Keys. These strong winds will gradually make their presence known further northward throughout the evening and overnight tonight, reaching the Panhandle tomorrow morning. Winds will increase in strength as the storm makes its final approach, with devastating hurricane-force wind gusts up to 125mph (200 km/h) projected for areas closest to where the storm will make landfall.

Inundating rainfall causing widespread flooding is also a major concern with Hurricane Helene across Florida with over 5 inches (127mm) of rain expected along the coast and lesser amounts of under 2 inches (51mm) further inland. Rainfall totals could easily exceed 10 inches (254mm) throughout the Panhandle.

Along with intense winds and flooding rainfall, life-threatening storm surge is expected along the entire Gulf Coast of Florida and the Big Bend Coast could see water levels exceeding 10ft. These factors all combined have prompted widespread Hurricane and Tropical Storm Warnings, evacuations, and States of Emergencies in almost every county in the state.


Forecast Track for Hurricane Helene, Courtesy of The National Hurricane Center.

Beyond landfall, the storm is expected to pack quite a punch through the rest of the Southeast and into the Ohio Valley with intense winds and heavy rainfall.

The destructive wind gusts will push their way well inland into Southern Georgia and even as far north as the Southern Appalachians. These strong winds will easily bring down trees and power lines, resulting in widespread power outages, as well as damage to property.

The Blue Ridge Mountain and Piedmont Regions of Northern Georgia and the Western Carolinas are also possibly looking at receiving up 12 inches (305mm) of rain by the end of the weekend as the storm is expected to stall beginning late Friday. This much rain will bring the risk of flooding and landslides across the region.


GOOGLE AD (NOT ENDORSED BY INSTANT WEATHER)

Helene will remain in an ideal environment over the next 24 hours with sea surface temperatures above 30°C, relatively low shear, and strong upper-level divergence, all key for rapid intensification of a tropical storm/hurricane. There is a bit of uncertainty of exactly how strong Hurricane Helene will become, with some weather models suggesting it could reach Category 4 strength, however, it is increasingly likely that it will make landfall as a Category 3 Hurricane.

It is not too late to take necessary precautions to protect life and property ahead of this storm. If you or your loved ones are in the path of the storm, please heed all directives from emergency personnel and stay safe!


Forecast Track and Intensity of Hurricane helene with Sea Surface Temperatures, courtesy of Tomer Burg.

Hurricane Ernesto's Track Through Atlantic Canada Becoming Clearer; Could Maintain Category 1 Strength Deep into Canadian Waters

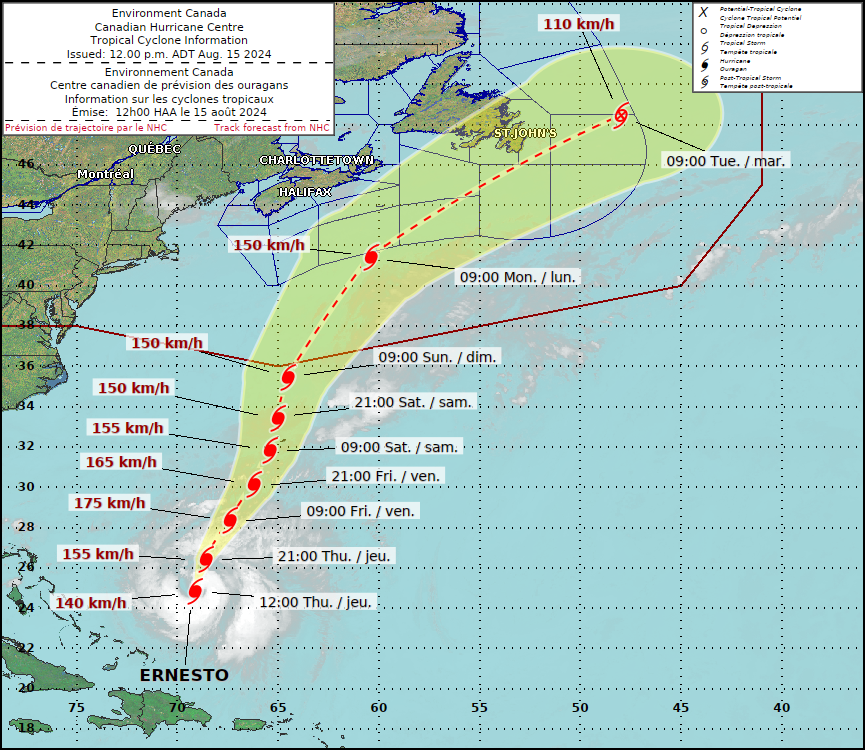
Forecast track for hurricane Ernesto from the Canadian Hurricane Centre - August 17th at 9Am

Hurricane Ernesto made landfall on Bermuda early this morning as a Category 1 Hurricane. The storm luckily weakened from a Category 2 in the few hours before landfall, but it still packed a punch with 135km/h winds. Now the storm will continue to churn northeastward into Atlantic Canada for the beginning of next week.


GOOGLE AD (NOT ENDORSED BY INSTANT WEATHER)

The Canadian Hurricane Centre is now issuing their own forecast track and there has been very little change in their prediction with their 9am update compared to the maps from the past two days. They maintain that the centre of Ernesto will stay well offshore of Nova Scotia and pass south of the Avalon Peninsula. Major weather models have made a shift since yesterday morning and now there is agreement that the centre of the storm will stay off the coast of Newfoundland. This is certainly good news because this will keep the strongest winds from hitting land, but it will still be an impactful storm.

Now that we’re starting to see a clearer picture of Hurricane Ernesto’s path through Atlantic Canada, we can more accurately forecast the impacts of the storm, especially for the Maritimes. Pounding surf will hit the Atlantic Coast of Nova Scotia beginning late Sunday and continuing through Monday. Rip currents will also be a concern in these coastal areas. Light rain from the storm will spread across Nova Scotia and even into PEI and Southern New Brunswick, with rainfall totals at this point expected to be in the 5-30mm range across the region for Monday. Exact amounts and locations will become clearer by this time tomorrow. Since the storm will be passing so far offshore, winds will not be a concern in the Maritimes.

Newfoundland, particularly the Burin and Avalon Peninsulas, will get hit harder than the Maritimes since Ernesto will be passing much closer. Southwest-facing coastlines can expect to begin seeing the ocean swell from the storm beginning late Sunday with large waves and hazardous surf starting late Monday and continuing into Tuesday. These waves and the storm surge will likely result in coastal flooding along these southwest-facing shores. Since Ernesto is expected to pass close to the Avalon late Monday, the winds won’t be as strong on land as they will be closer to the centre of the storm. Nonetheless, wind gusts of up to 100km/h can be expected along the southern shores of the Avalon, especially from Saint Vincent’s to Cape Race, and weakening further inland. Rainfall will be heavy for a brief period of time late in the day Monday for Eastern Newfoundland, including into Bonavista. Light rain will spread across the rest of the Island ahead of the storm Monday afternoon. It is still a bit too early to predict exact totals, but at this point the Avalon could see 30-50mm of rain in a 6 hour period.


Model Forecast Tracks for Hurricane Ernesto, Courtesy of Tomer Burg.

While the track of Ernesto through Atlantic Canada has become clearer, the intensity at which it will travel through the region appears to have also become clearer. The Canadian Hurricane Centre predicts that Ernesto will maintain hurricane strength up to its final approach of Newfoundland, with winds of 120km/h, which is just above the threshold for a storm to be considered a hurricane. Then, just as it passes south of the Avalon, it will transition to a post-tropical storm.


GOOGLE AD (NOT ENDORSED BY INSTANT WEATHER)

Previous forecasts from the CHC/NHC showed that Ernesto would weaken somewhere between being offshore of Nova Scotia and around the Avalon, with no indication of where this transition may take place. This has now become clearer now that the storm has passed over Bermuda. Ernesto will experience a decrease in shear, giving the storm a chance to recover from ingesting so much dry air and it will undergo a short period of restrengthening tomorrow before hitting the point in which sea surface temperatures drop below 26°C and it begins to lose fuel. The image below shows that wind speeds at the storm’s centre will increase between Hour 24 and Hour 48, indicating this window of restrengthening. As a result of this strengthening in the storm, it will then take a bit longer to weaken to a post-tropical storm and it will maintain its status as Category 1 Hurricane deeper into Canadian waters. We will continue to monitor the storm and we will have our own rain and wind forecasts coming later tomorrow.


Forecast Track and Intensity of Hurricane Ernesto with Sea Surface Temperatures, courtesy of Tomer Burg.

Hurricane Ernesto Still on Track to Impact Atlantic Canada; Could Pass Through Newfoundland

Forecast track for hurricane Ernesto from the Canadian Hurricane Centre - August 16th at 6Am

Ernesto is continuing to barrel towards Bermuda, now as a Category 2 Hurricane, with wind speeds up to 160km/h. The centre of the storm is expected to pass near or over the island on Saturday while maintaining its strength at a Category 2.


GOOGLE AD (NOT ENDORSED BY INSTANT WEATHER)

The Canadian Hurricane Centre and the National Hurricane Center have made very little change to their track forecast for Ernesto in the 6am update as it travels northeastward towards Atlantic Canada beyond Bermuda. There is still a large degree of uncertainty since we are still a few days out and this is reflected in the size of the cone on the forecast map.

Individual weather models, on the other hand, have begun to show a western shift. There still are a few models that are more in line with the NHC forecast that keeps Ernesto passing offshore of the Avalon. However, just as many are now suggesting that the storm could pass over the Peninsula instead and one outlier still has it tracking through Central Newfoundland. We may see a change in the official forecasts from the CHC and NHC that reflects this western shift in the models.

There is definitely more agreement in the path of Ernesto as it passes offshore of Nova Scotia on Monday. The amount of rain it brings to the Maritimes will be entirely dependent on just how far offshore it stays. Nova Scotia will most likely see rain, but if the storm passes closer to the province, we could see rain move into New Brunswick and PEI as well. Given its offshore track, strong winds likely won’t be much of an issue, but pounding surf is expected to begin for the Atlantic Coast of Nova Scotia ahead of the storm on Sunday and continuing until after its passing on Tuesday.

The exact impacts to Eastern Newfoundland will be entirely dependent on the path that Ernesto takes either around or through the province. The strongest winds will be found around the centre of the storm and at that point in the storm’s life, gusts are projected to be around 110km/h so hopefully it will stay offshore. Rainfall across the province will also vary, with higher amounts expected closer to the middle of the storm. These impacts will become clearer once there is more consensus in the track. The hazardous surf will hit south-facing shores of Newfoundland beginning late Sunday and large waves should impact the Avalon and Burin Peninsulas throughout the day Monday. The large waves, combined with storm surge. could result in coastal flooding so be sure to exercise caution in these areas.


Model Forecast Tracks for Hurricane Ernesto, Courtesy of Tomer Burg.

Ernesto strengthened into a Category 2 late yesterday and further strengthening stalled overnight, despite being in warm water, likely due to continued ingestion of dry air. It is expected to continue to strength through today, but that could be limited by an increase in wind shear, which works against hurricanes. At this point, Ernesto will top out at a Category 2.


GOOGLE AD (NOT ENDORSED BY INSTANT WEATHER)

Hurricane Ernesto will begin to lose strength after it hits Bermuda and pushes northward into cooler waters and experiences increased shear. It will enter Canadian waters as a weak Category 1 Hurricane and it should rapidly weaken into a post-tropical storm as it approaches Newfoundland mostly due the much cooler sea surface temperatures, but also even more wind shear. Hurricanes need water temperatures of at least 26°C to survive and Ernesto will lose that as it tracks into Atlantic Canada. Nonetheless, winds at the centre of the storm are still expected to be in the 110-150km/h range as it moves through the region.


Forecast Track and Intensity of Hurricane Ernesto with Sea Surface Temperatures, courtesy of Tomer Burg.

Hurricane Ernesto Likely to Impact Atlantic Canada; Uncertainty Looms on Exact Track

Forecast track for hurricane Ernesto from the Canadian Hurricane Centre - August 15th at 12pm

Hurricane Ernesto is currently a Category 1 Hurricane and is still moving northeastward towards Bermuda. While it is fairly certain that the island nation will take a direct hit from the storm, its track as it continues northward into Canadian waters is much more uncertain.


GOOGLE AD (NOT ENDORSED BY INSTANT WEATHER)

In the 12pm update from the Canadian Hurricane Centre, in conjunction with the National Hurricane Center in the US, Ernesto is still expected to have some sort of impact to the Maritimes and Newfoundland, despite the uncertainty in the exact track.

Guidances from different individual weather models, as shown below, indicate potential paths that the centre of the storm may take over the next few days. In some cases, the storm may stay well offshore and only sideswipe Newfoundland with heavy rain and wind while missing the Maritimes completely. On the other hand, one model has the storm tracking straight though Central Newfoundland, which would not only greatly impact the island, but this track would also bring rain and wind further west into the Maritimes.

However, we are starting to see some agreement between some of these models that would see Ernesto stay well offshore of Nova Scotia, with only a bit of rain hitting the province, before passing just south of the Avalon Peninsula, bringing strong winds and heavy rain to Eastern Newfoundland and strong surge to coastal areas across Atlantic Canada. The swells are expected to arrive in the Maritimes beginning Saturday, with more dangerous surf starting Sunday, ahead of the storms arrival to the region early Monday.


Model Forecast Tracks for Hurricane Ernesto, Courtesy of Tomer Burg.

So what are we looking at strength wise? Ernesto is currently a Category 1 in 29°C waters. This sea surface temperature will certainly help the storm strengthen, however, dry air is being pulled into the centre of the storm which is limiting its organization. The warm waters and dry air, combined with some moderate vertical shear (which needs to be low in order for a hurricane to survive and strengthen), means that Ernesto will strengthen to a strong Category 2 Hurricane.


GOOGLE AD (NOT ENDORSED BY INSTANT WEATHER)

As the storm continues to travel north-northeastward beyond Bermuda, it will encounter cooler waters and shear will increase, which will work to weaken it back down to a Category 1. As it moves into Canadian waters, the sea surface temperatures fall below 26°C. This is the magic number for hurricane development and growth so at this point, it will weaken even further. Ernesto expected to travel through the region starting as a low-end Category 1 and weakening to a post-tropical storm, with winds in the centre of the storm in the range of 110-150km/h.


Forecast Track and Intensity of Hurricane Ernesto with Sea Surface Temperatures, courtesy of Tomer Burg.